Vulnerability scans show a large volume of vulnerability data which could be unstructured and complex to analyze. Bulky, hard-to-read data creates chaos during the rating and delays the remediation process. A well-structured, neatly organized vulnerability management dashboard will help CISOs, and then IT security admins quickly analyze their vulnerability management platform and bring some changes to the process.
Whether for improving an existing vulnerability management platform or implementing a new vulnerability management software, an insightful dashboard is a prime need.
Finally, let us understand the metrics required for your vulnerability management dashboard to help you gain absolute clarity over your network’s vulnerability exposure.
Ideal Metrics for Your Vulnerability Management Dashboard
| Ideal Metrics | Description |
| Vulnerability statistics based on the severity | Remediation teams have a huge pile of vulnerabilities to fix, and they often get confused about what vulnerability to remediate first. Hence, vulnerability statistics will help the remediation team to prioritize the vulnerabilities based on their severity. Vulnerability statistics must be represented in graphs and charts to understand the severe vulnerabilities that need patching immediately and clearly. It should be categorized based on severity, such as low, medium, high, and critical. |
| Level of risk exploitability | There are numerous ways for hackers to barge into any network or asset. So, it is essential to categorize and determine possible modes of vulnerability exploitation. The exploitability of vulnerabilities must be depicted in terms of percentages. The dashboard should display the vulnerability as easily exploitable, network exploits, and publicly exploited vulnerabilities. |
| Top vulnerabilities based on operating systems | Operating system vulnerabilities are a threat to your entire IT ecosystem. Ensure that the vulnerability management tool shows the top vulnerabilities categorized based on the operating system. For instance, top vulnerabilities in Windows, Linux, and Mac should separate into columns. |
| Vulnerability aging | Usually, older vulnerabilities are swept under the rug. Hackers might dig up these vulnerabilities and exploit them. Vulnerability aging on the dashboard will help you identify old vulnerabilities from the exploitation day. |
| Top vulnerable assets | Some CVEs are routinely exploited. To instantly remediate, keeping track of the most seen CVEs is essential. The most seen CVEs dashboard can provide a list of CVEs and their severity, mostly seen in the organization’s environment. |
| Vulnerability trends by severity | The flat CVSS score depicts the current severity. For long-term assessment and to measure the progress of remediating or mitigating the vulnerabilities, vulnerability trends graphs are necessary. The vulnerability trends dashboard should provide vulnerability trends from the past 30 days, quarterly or semi-quarterly. It can be depicted through a line graph with vulnerability trend count in each risk level. |
| Most seen CVEs | Some CVEs are routinely exploited. To instantly remediate, it is essential to keep track of the most seen CVEs with the help of vulnerability management software. The most seen CVEs dashboard can provide a list of CVEs and their severity, mostly seen in the organization’s environment. |

Essential Metrics Displayed in SanerNow Vulnerability Management Dashboard!
Indeed, SecPod SanerNow provides a comprehensive dashboard to get clear visibility and control over the vulnerabilities in your network.

1. Vulnerability statistics
The discovered vulnerabilities are in categories based on severity and then shown in the Vulnerability Statistics view.

2. Exploitability
Vulnerable assets based on exploitability level are here in the exploitability panel that is SanerNow categorizes vulnerabilities as easily exploitable, network exploitable, public exploit available, & high lateral movement. It is as follows:
- Easily exploitable
SanerNow vulnerability management software detects vulnerabilities in devices that exploit easily.
- Network exploitable
It also shows network vulnerabilities that might exploit through a network.
- Publicly exploit available
The exploit code is available publicly in publicly exploit, which can be dangerous.
- High lateral movement
Evidently, the high lateral movement metric simplifies gauging the privilege escalation of the hacker. Whereas, it determines how deeply a hacker has got into the network or devices to access the privileges.

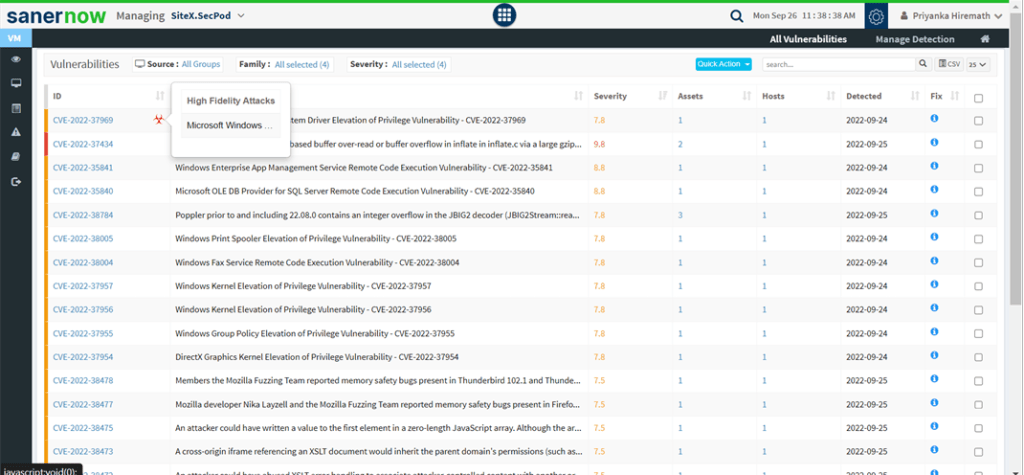
3. High-fidelity attacks shown in vulnerability management dashboard
Moreover, in SanerNow, you can compare all the discovered CVEs with our studied MVE (Malware Vulnerability Enumeration) data. In contrast, we identify the vulnerabilities which cause high-fidelity attacks.


4. Vulnerable Devices
SanerNow categorizes the vulnerable devices:
- Vulnerable devices based on source
In the organization, someone can group assets department-wise, and these groups might include various operating systems.
- Vulnerable devices based on Operating systems
By default, SanerNow vulnerability management software categorizes the assets by their operating systems.
- Vulnerable devices based on the severity
SanerNow groups vulnerable devices based on severity metrics, and then it includes critical, high, low, and medium.

5. Vulnerabilities are shown in the vulnerability management dashboard
The tabular form describes the hostname, the group it belongs to, the host’s operating system, and the risk count. In addition, a severity distribution table is for easy capture of vulnerable devices. The status and last scan help to know if the saner agent is frequently scanning for asset vulnerabilities.
SanerNow lists the vulnerabilities detected with all the corresponding information, like the severity of the vulnerability, assets affected, and a fix for the vulnerability provided for instant mitigation.

6. Vulnerability by OS
Conversely, SanerNow Vulnerability Scanner provides a simple pie chart depicting vulnerabilities in the operating systems. This information can also be in conversion for CSV format for better interpretation.

7. Vulnerability by group
On the contrary, SanerNow simplifies group assets in the organizations. Someone puts these groups across the bar chart that depicts the count of vulnerabilities in each operating system. Finally, it will help you gain an understanding of which operating systems are more vulnerable.

8. Vulnerability aging
On the other hand, someone sweeps older vulnerabilities under the rug. However, hackers might dig up these vulnerabilities and exploit them. Vulnerability aging helps to know how old the vulnerabilities from the day of exploitation.

9. Top vulnerable assets are shown in the vulnerability management dashboard
For the same reason, SanerNow lists all vulnerable assets and the top vulnerable assets. Moreover, SanerNow vulnerability management tool provides the feature to set the number of days to track vulnerable assets. Further, you can select the assets and exclude or remediate all the vulnerabilities corresponding to an asset.

10. Top remediation recommendation as shown by the vulnerability management dashboard
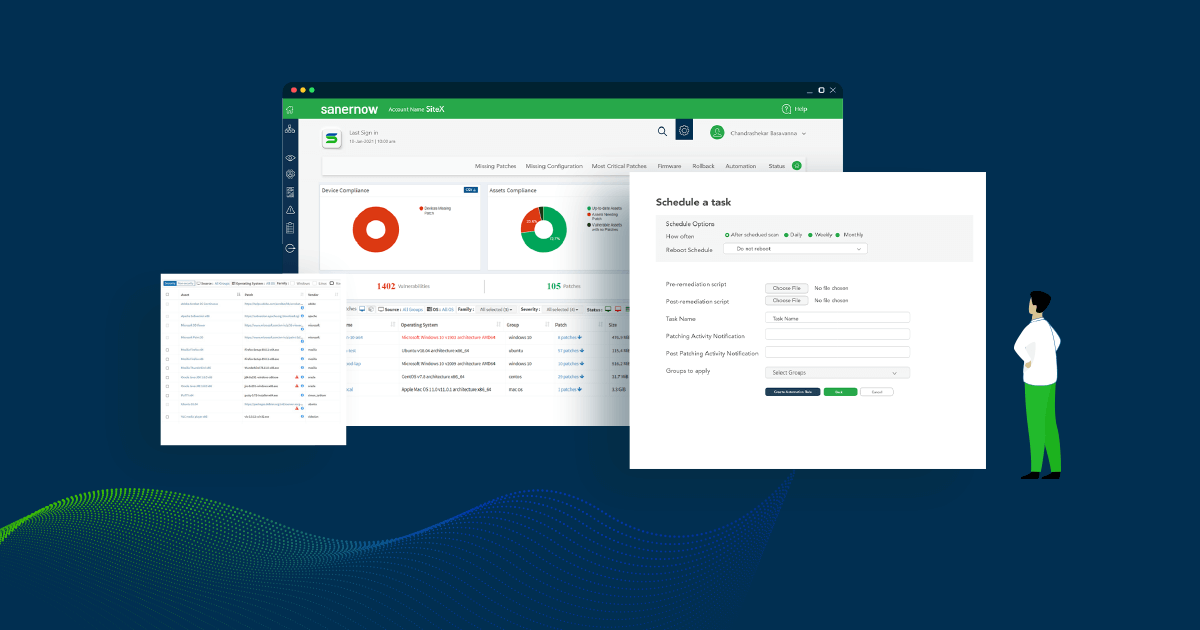
However, SanerNow redefines vulnerability management platform as a steady cycle from identification to remediation of vulnerabilities. Once you know the vulnerabilities, SanerNow also recommends fixing the vulnerabilities by adding patches.

Final Thoughts
In fact, with an ideal understanding of the vulnerability management dashboard, CISOs, and IT security teams will have more clarity and control over the organization’s security posture.
Now that you’ve heard that, what are you waiting for?
Therefore, develop a sharp and actionable vulnerability management dashboard and guard your network against cyberattacks with SanerNow AVM.

