IDA Pro is primarily a multi-platform, multi-processor disassembler that translates machine executable code into assembly language source code for the purpose of debugging and reverse engineering. On various platforms, people are using it as a local or as a remote debugger. The development of Plug-ins can occur, which support a variety of executable formats for different processors and operating systems. To avoid any problems that might occur during the translation of machine code into assembly language source code, we can use a vulnerability management software.
Here is the screenshot of the IDA Pro Desktop:
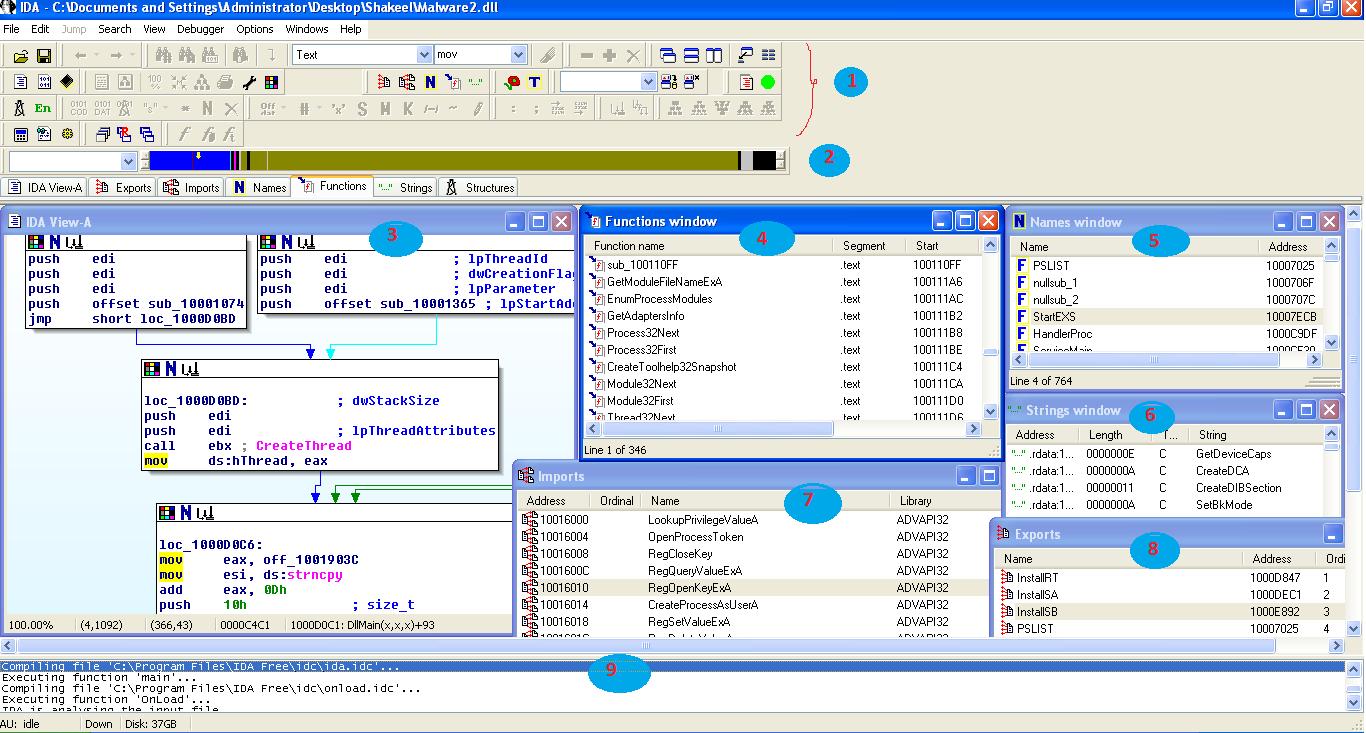
1) The toolbar area is the space below menu bar where the docking of the tools happen.
2) Navigation band is the horizontal color band below the toolbar area, which can be to jump to particular code region of the execution code under analysis. It represents the address space of the executable. Light blue is library code, red is compiler-generate code, and dark blue is user-written code. Code analysis is usually occuring in the user-written code region.
3) Dis-assembly window is the primary window showing the assembly level code of executable under analysis. This window is available in graph mode (as shown above in figure) and text mode. Graph mode view represents program control flow. In graph mode, the execution code is broke into blocks of functions with color arrows showing control flow between the function blocks. If the arrow is red, a conditional jump is not taken. If it is green, then a jump is taken; if the color is blue, an unconditional jump is taken.
IDA Pro is primarily a multi-platform, multi-processor disassembler that translates machine executable code into assembly language source code for the purpose of debugging and reverse engineering. On various platforms, people are using it as a local or as a remote debugger. Moreover, the development of Plug-ins can occur, which support a variety of executable formats for different processors and operating systems, ensuring seamless integration and performance across platforms.
Here is the screenshot of the IDA Pro Desktop:
A good Vulnerability Management Tool can prevent these issues from occurring.
These are the steps to attain the screenshot:
1) The toolbar area is the space below menu bar where the docking of the tools happen.
2) Navigation band is the horizontal color band below the toolbar area, which can be to jump to particular code region of the execution code under analysis. It represents the address space of the executable. Light blue is library code, red is compiler-generate code, and dark blue is user-written code. Code analysis is usually occuring in the user-written code region.
3) Dis-assembly window is the primary window showing the assembly level code of executable under analysis. This window is available in two formats: graph mode (as shown above in figure) and text mode. Graph mode view represents program control flow. In graph mode, the execution code is broke into blocks of functions with color arrows showing control flow between the function blocks. If the arrow is red, a conditional jump is not taken. If it is green, then a jump is taken, and if the color is blue, an unconditional jump is taken. On the other hand, in the text mode presents the entire disassembled code of the executable under analysis. Here in text mode, an arrow facing up indicates a loop, the unconditional jump is indicated by solid lines, and conditional jumps are shown as dashed lines.
4) Functions window :
it shows all the functions in the executable. This window can be of use to differentiate the functions on the basis of length as well as type. It uses flags like F, L, S, and so on to indicates function type.
5) Names window shows functions, named data, named code, and strings address with a color and letter-coded name.
I indicate an imported name,
F indicates a regular function,
L indicates a library function,
D indicates named data locations,
A indicates ASCII string data location and
C indicates named code that is memory location,
6) Strings window shows ASCII strings within the executable.
7) Imports window lists all functions that are acting as imports by the file under analysis.
8) Exports window shows all the functions and variables that the file under analysis exports to be of use other files.
9) Message window is the status window that displays the output generated by IDA Pro, which may be error messages or the status of ongoing analysis.
Some useful IDA pro-plug-ins are :
1) AsPack/ASPR: A plug-in that can be of use to unpack or de-compress files compressed using Win32 file compressor.
2) Hex-Rays Decompiler: A plug-in that translates an object file into a compatible source file.
3) Stealth: An open-source anti-debugger plug-in that tries to hide the IDA Pro from the most common anti-debugging techniques.
4) PatchDiff2: An open-source plug-in that can be of great use to compare two IDA Pro database (IDB) files and find the differences between both.
5) IDAPython: An open-source plug-in that combines the Python programming language with IDA Pro, thus allowing scripts to run in IDA Pro.
6) Ida struct: An open-source plug-in that helps recognize high-level objects and structures in binary code.
7) EPF – Entry-Point-Finder: A plug-in that can be of to get the original entry point of a packed or crypt-ed Windows PE executable.
– Shakeel
Have any questions on how to fix CVE-2017-8529 specific to your IT? Let’s discuss.