Motivation
There are too many vulnerabilities. Past research shows firms are able to fix 5%-20% of known vulnerabilities in a month. Moreover, a small subset of vulnerabilities (2%-7%) are seen to be exploited in the wild.
Furthermore, there is no single answer or a collection of metrics to help inform or guide the prioritization decisions.
Going Beyond CVSS
The Exploit Prediction Scoring System (EPSS) is a data-driven effort to estimate the likelihood or probability that a software vulnerability will be exploited in the wild. Going beyond CVSS for prioritization would consider various parameters some are mentioned below,
- Text-based tags from the CVE description
- Published Exploit code – Metasploit, Exploit DB, GitHub
- Published Date
- Vendor References
- Security Scanners – Jaeles1, Intrigue2, Nuclei3, Sn1per4
- Ground truth – daily observations of exploitation in the wild activity from Alien Vault, Fortinet, etc.
Strategy
Let’s begin with a simple strategy of remediation of all CVEs with CVSS score >=7
- Would we choose to remediate or not?
- Would this be observed as exploited or not?
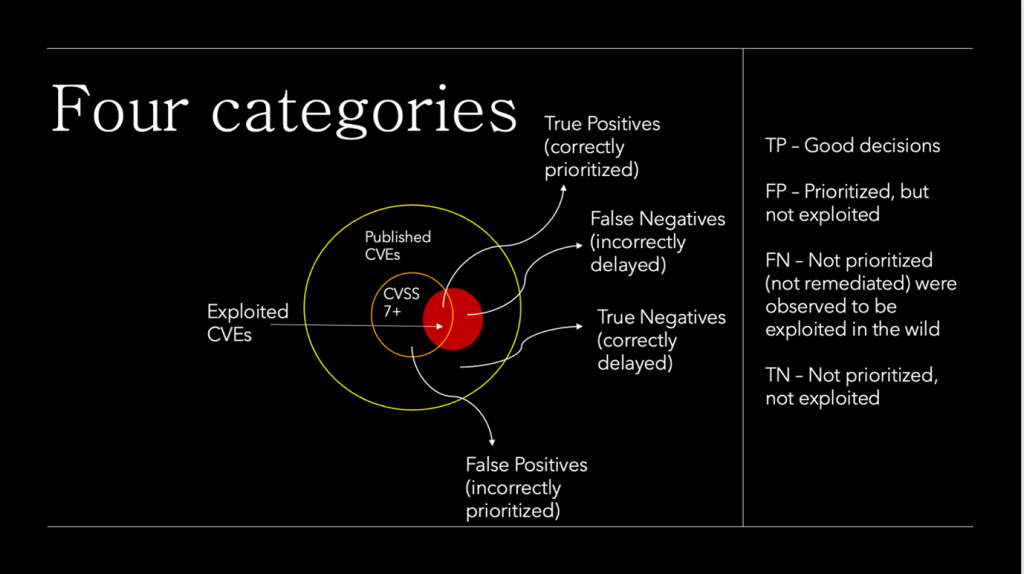
There are four possible categories that the decision to remediate vulnerabilities may fall under. True Positives, where vulnerabilities remediated are actively exploited. True Negatives, where vulnerability remediation is correctly delayed because they were not out in the wild. False Positives, where vulnerabilities are incorrectly prioritized, and False Negatives – the vulnerabilities that should have been fixed immediately but were wrongly delayed.
Efficiency and Coverage
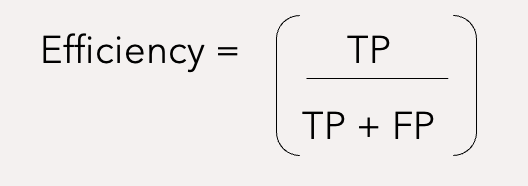
Based on the above reasoning, we can derive two meaningful metrics – efficiency and coverage, what information theory calls precision and recall. Precision attempts to answer the question, what proportion of positive identifications was actually correct Recall attempts to answer the question, what proportion of actual positives was identified correctly

Efficiency
Efficiency determines how effectively resources were spent by measuring the percentage of remediated vulnerabilities that were exploited.
In other words, it is the amount of orange circle covered by the red circle in Figure 1,
Coverage
The percentage of exploited vulnerabilities that were remediated. In other words, the amount of red circle covered by an orange circle.
Low Efficiency implies remediating random or mostly non-exploited vulnerabilities.
Low Coverage indicates that many of the exploited vulnerabilities were not remediated.
Efficiency and Coverage in the real world

With a remediation strategy based exclusively on CVSS v3.1 and a threshold set for scores at 8.8 or higher, 253 vulnerabilities out of every 1,000 vulnerabilities would be flagged for remediation. Out of those flagged, 5% had observed exploitation activity, and of those exploited, this strategy covered about 50.7% of those.
With a strategy of EPSS v1 (developed in early 2019) and a threshold set for scores at 0.066 or higher, 93 out of every 1,000 vulnerabilities would be flagged for remediation. Out of those flagged, 12.9% had observed exploitation activity and a comparable 51.2% coverage was observed.
With a strategy of the newly released EPSS scores and a threshold set for scores 0.149 or higher, 47 out of every 1,000 vulnerabilities would be flagged for remediation. Out of those flagged, we have a large jump in efficiency up to 42.9% which maintains roughly the same amount of coverage at 50.9%.
This exercise demonstrates the enterprise resource savings obtainable by adopting EPSS as a prioritization strategy. Using EPSS v2 requires organizations to patch fewer than 20% (47/253) of the vulnerabilities they would have mitigated, compared to using a strategy based on CVSS.
Maintaining Capacity
Within a strategy, coverage and efficiency are balanced with effort, but a better strategy can offer better coverage and efficiency with reduced effort.
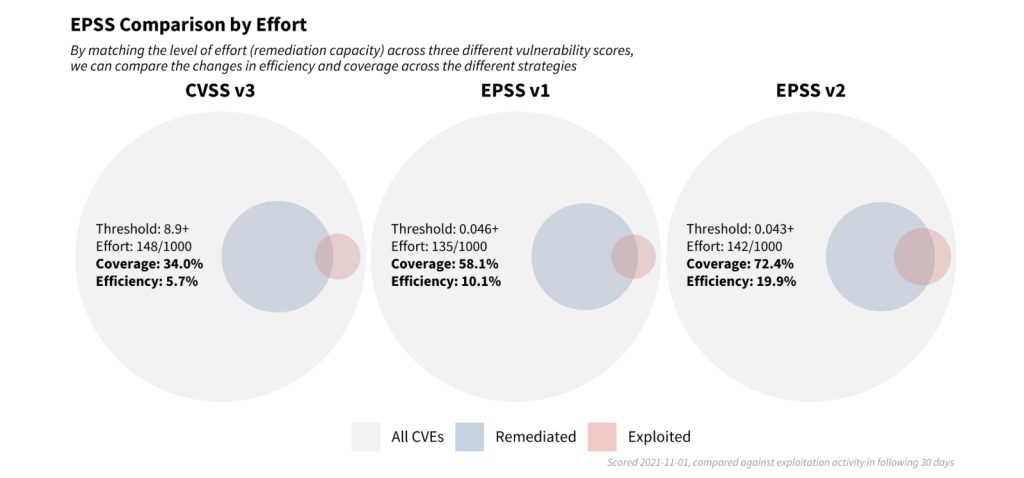
Recent research finds that the median capacity across hundreds of organizations was 15.5% so we targeted a strategy matching this finding of addressing about 150 out of every 1,000 vulnerabilities.
Note how the blue circles are approximately the same size across each of the three strategies (the set of scored CVEs was not the same across each strategy, so the red and blue circles vary slightly). However, the level of efficiency and coverage are not the same. Moving from left to right in the strategies (CVSS v3, EPSS v1 to EPSS v2) we are improving both the efficiency of remediation and the coverage of the exploited vulnerabilities.
A plot of Coverage and Efficiency for EPSS V2, V1, and CVSS V3.
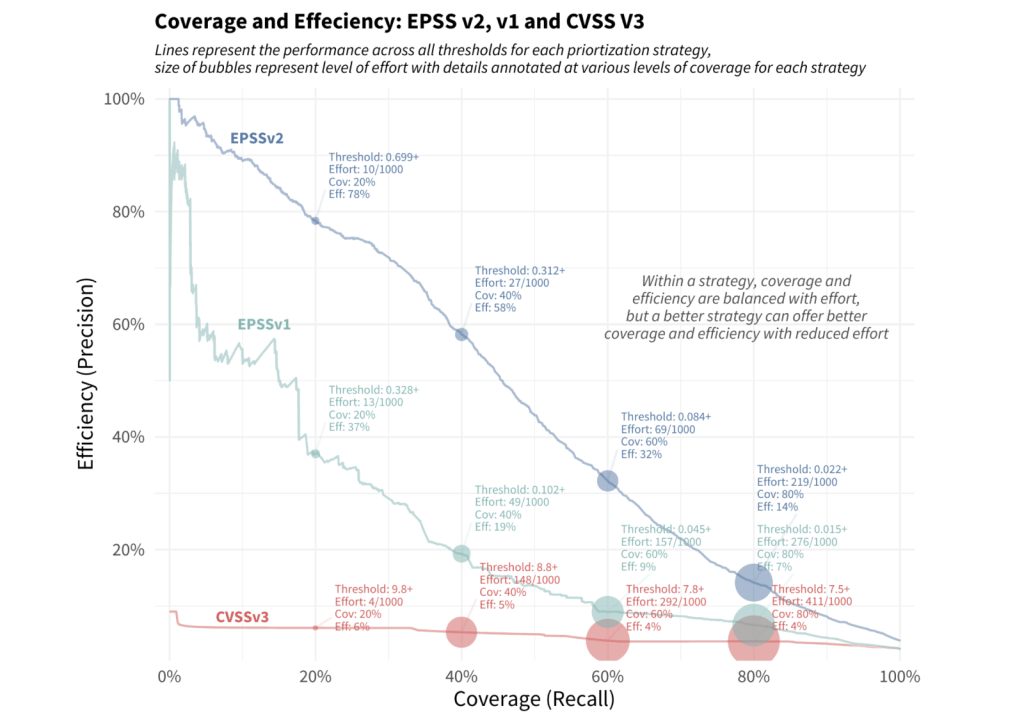
The red line across the bottom reflects a remediation strategy using the CVSS v3.1 base score. Note the relatively constant level of efficiency, and in order to improve coverage we have to remediate more and more vulnerabilities at the same level of efficiency.
The green-blue middle line illustrates a strategy using EPSS v1, which achieves a higher level of efficiency and coverage than CVSS alone, though the performance has degraded since it was first developed.
The upper blue line represents the latest EPSS model. Smaller organizations can achieve remarkable efficiency with limited resources, and organizations that have more resources can achieve better efficiency and coverage than either of the other two strategies.
Typically there is a trade-off between coverage and efficiency, but by shifting a prioritization strategy to reference the latest EPSS scores, organizations can see a marked improvement over other existing methods available to them.

Interpreting a gradient-boosted model has some challenges since it builds in interaction effects (for example, the impact of a remote code execution vulnerability may depend on whether it’s in desktop software versus networking equipment). This causes the weights and contributions of variables to shift around from one vulnerability to the next, so specific contributions are difficult to extract and communicate. We turn to SHAP values, which stands for SHapley Additive exPlanations, a concept derived from game theory and used to explain the output of machine learning models. SHAP values help interpret how much a given feature or input contributes, positively or negatively, to the target outcome or prediction.
References:
The EPSS Model: http://firstgov.net/model.html

