Security teams juggle many findings and dashboards across accounts. A single, consistent score helps decide what to fix first, then shows progress with less debate. That is the purpose of Cloud Cyber Hygiene Score.
What the Score Means
CCHS blends two views of risk. The global score normalizes a resource’s raw score, and the local score shows where that resource stands within its peer group in the same account. The resource score is a weighted average of the two, with a default split of 80% global and 20% local.
Raw risk rolls up posture, identity, remediation, and anomaly inputs. Teams can adjust weights for CSPM, CSPA, CIEM, and CSRM. The platform then converts that result to global and local values that feed the resource score.
Ranges and Tiers That Set Clear Expectations
Perfect safety is not realistic, so the model caps near one hundred. Minimum and maximum fall near 0.96 and 99.6. It’s important to remember that higher the resource cyber hygiene score, lower is the risk involved with that resource.
Risk tiers are straightforward. A resource under 35 sits in the highest risk band, 35 to under 60 is high, 60 to under 85 is medium, and anything at least 85 is low.
From Resource to Account to Organization
Account score is the average of resource scores. Organization score is a weighted average of account scores using the number of resources per account as weights.
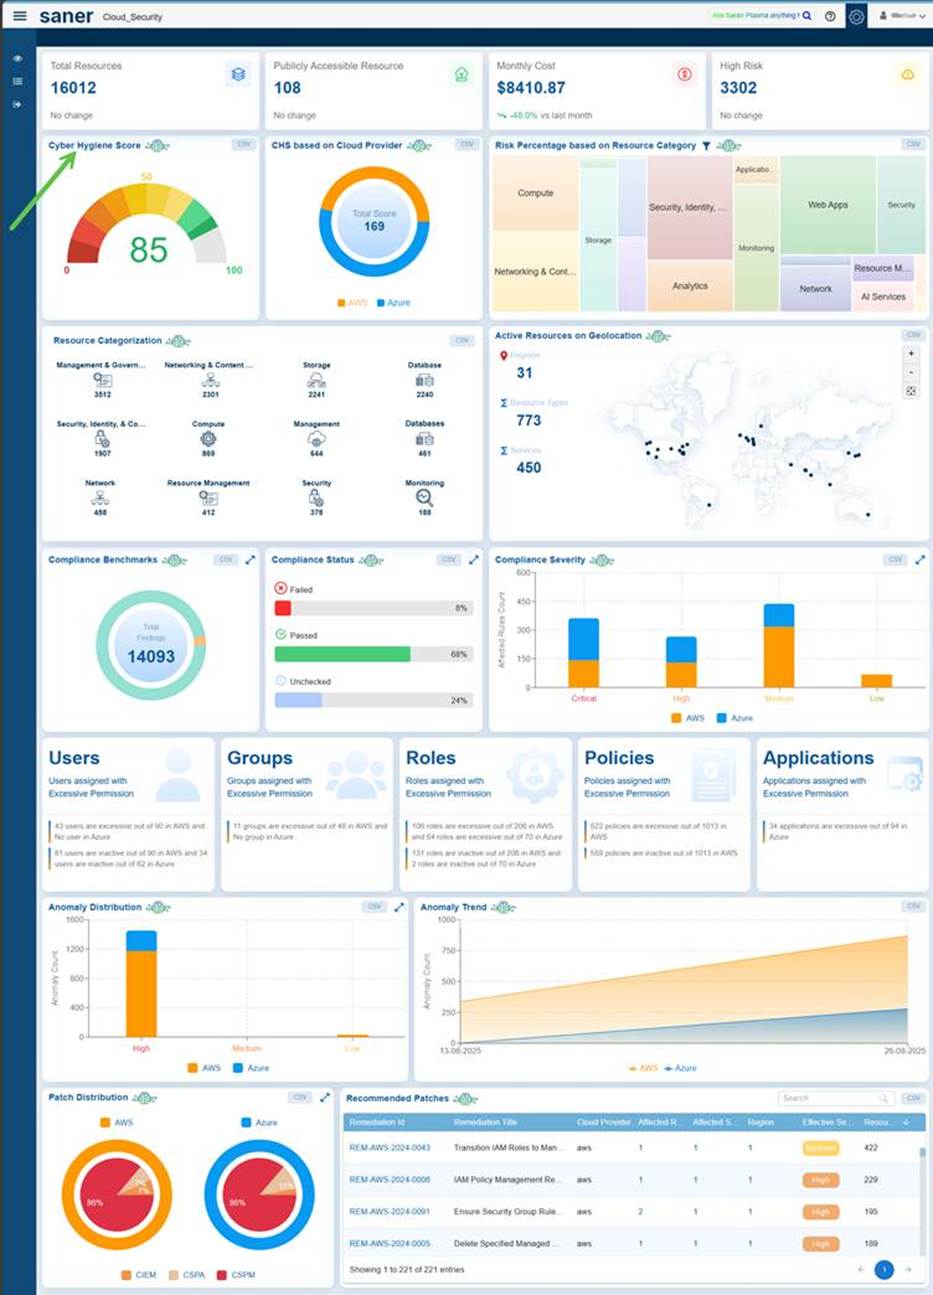
Dashboards That Move Work Forward
Teams get a quick meter for the latest score, a distribution view of which modules drive risk, and a thirty-day trend with a forward view. The dashboard also lists resource severity, the ten services with the most impact, heat maps by category, a resource table with region and type, and a contributors list for context.
- Metered score for an account, plus trend over the past thirty days, with a projected view.
- Top 10 Services by Risk to point owners to fixes that shift the score.
- Category heat map and resource table with local, global, and overall scores, plus region and type.
How Different Roles Can Use the Score
Platform owners track one number across accounts, then drill into services that drag the average down. Analysts use local versus global values to spot outliers in a class or confirm that a pattern is wide. Managers scan the thirty-day trend before a review, then pull the contributors list to explain the change.
Why multi-account teams benefit
Weighted roll-up matches how risk often concentrates in larger accounts. Region appears in the resource overview, so owners can see clusters and route work to the right team.
What you can do this week
- Set module weights that reflect your priorities, then review CHS Distribution to pick fast wins.
- Use the Top 10 Services list to assign owners for the highest-impact items.
- Track the trend for the month, and use the contributors list to explain swings.
Experience Saner Cloud Live
Your organization deserves the best cloud security! Schedule a demo of Saner Cloud to see CCHS on your own accounts, with a walkthrough of the dashboards and roll-ups.