Report Views provide a structured, customizable, and interactive way to explore and interpret data related to asset exposure, posture anomalies, patch management, entitlement management, and posture management. Whether you need a high-level compliance summary or a detailed analysis of specific misconfigurations, Report Views ease analysis by enabling users to filter and visualize information across various organizational units and geographic locations. Additionally, users can view the latest data after a scan is run, set backup schedules, and share report views with a wider audience.
Core Capabilities of Report Views
Filters and Drill-down Views
Narrow down results by cloud provider, region(geographic map), service(charts or graphs), and critical activity (table and other views).
Pre-built and Custom Report Views
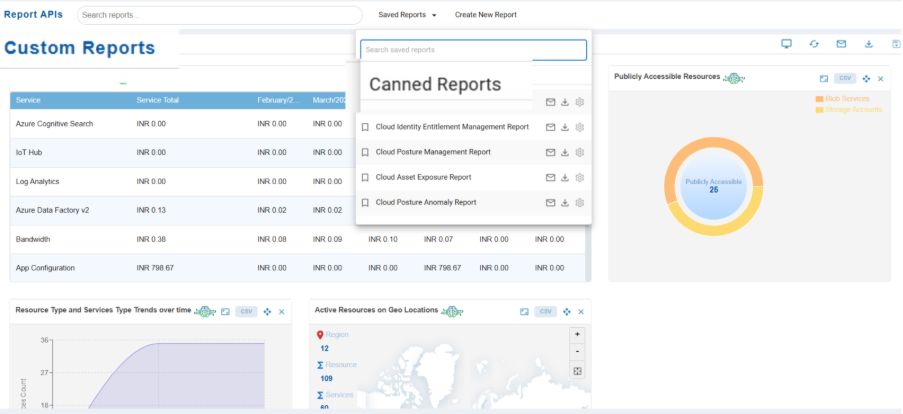
Canned Report(Default) views provide prebuilt visualizations of data that is stored across various tools within the cloud instance. These reports are specifically designed for checking the threat status in your organization. Custom Report views allow you to tailor how information is displayed, making analysis more effective and targeted.
Report Data Formats
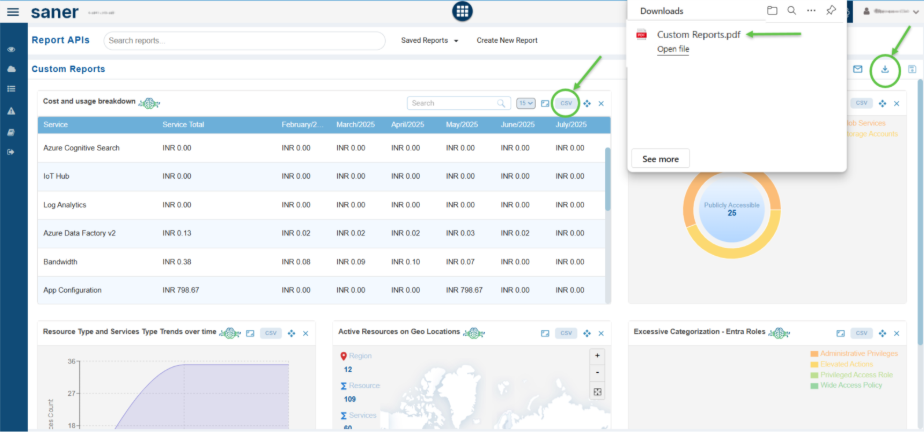
In addition to viewing the report data in grid view and spreadsheet (CSV) format, an added option is available to download the report as a PDF.
Backup Schedule for Report Views
Setting up specific time range or backup schedule makes it easier to view and analyze the latest data over a designated scan period.
Distribute Report Backup Views
For broader sharing and collaboration, users have the facility to distribute these report backups to one or more email addresses.
Implementing Report Views in the Cloud Dashboard
The Report Views architecture is designed to efficiently transform cloud and internal data into actionable insights. It begins with Data Ingestion, where posture, security, compliance, and user activity data are collected in real-time or on a schedule from sources like AWS, Azure, and internal systems. The Processing layer applies analytics through rule engines, machine learning, and statistical models to interpret the data. In the Report Definition Layer, both canned and custom report templates are defined with parameters such as filters, columns, sorting, and visualization types. The Storage Layer keeps these configurations, generated output snapshots, and grouping logic for future reference. Finally, the Presentation Layer renders interactive tables and charts with options for filtering, drilldowns, and exporting in formats like CSV or PDF, enabling users to explore and share insights effectively.
By abstracting complex data into customizable views, platforms empower users to investigate issues, ensure compliance, and take informed actions from a single page.
Types of Report Views
In a cloud security and operations environment, several types of reports are available to provide deep, actionable insights into posture, identity, asset exposure, patch status, and more. These reports are designed to help organizations check compliance, detect vulnerabilities, and improve cloud resource usage across regions and services. Standard report views(Posture Management, Identity Entitlement, Asset Exposure, Patch Management, and Posture Anomaly) offer a structured, benchmark-based, and visual analyses tailored to specific areas of concern. Each report type uses charts, maps, and tables to highlight trends, risks, and remediation priorities. In addition to these predefined views, users can also create Custom Report Views to focus on specific data points, apply targeted filters, label insights meaningfully, and automate distribution through scheduled backups. Together, these reporting capabilities empower teams to support a secure, compliant, and well-optimized cloud environment through both high-level summaries and in-depth evaluations.
Default or Canned
Canned Report views provide prebuilt visualizations of data that is stored across various tools within the cloud instance. These reports are specifically designed for checking the threat status in your organization.
Please note that the system does not allow modifications to the Default or Canned Report Views. However, users can alter the backup schedule and email to one or more recipients.
Posture Anomaly
The Posture Anomaly Report View offers a multi-dimensional analysis of security anomalies within a cloud environment, combining visual and tabular insights to aid in swift risk assessment and response. It includes a pie chart to categorize anomalies by confidence level, a bubble chart to highlight high-density issue clusters, and a radar chart to find prevalent posture weakness categories. Detailed anomaly data, including descriptions and confidence scores, support deep investigation, while an area chart tracks trends over time to reveal recurring issues or improvements. Additionally, geographic mapping across AWS regions finds regional misconfiguration hotspots. Together, these tools help security teams prioritize remediation based on severity, category, and location.
Asset Exposure
The Asset Exposure section of the Posture Anomaly Report View delivers a comprehensive analysis of cloud resource posture by integrating visibility, usage, and risk indicators across environments. It maps active resources by geographic location, flags outdated components, and provides a full inventory of assets with filtering options. Cost and usage insights link posture to financial accountability, while time-based trends in resource and service types, help detect scaling patterns and anomalies. Visual tools like pie charts and heat maps illustrate resource distribution and service concentration. Additionally, watchlisted resources highlight assets requiring attention due to potential risks. Collectively, these elements support initiative-taking management by uncovering inefficiencies, outdated resources, unusual growth trends, and exposure hotspots.
Patch Management
The Patch Management Report View provides a centralized, data-driven snapshot of patch availability, distribution, and remediation across cloud infrastructure, empowering teams to improve patch compliance and reduce vulnerability exposure. It includes geolocation-based maps to assess regional patch coverage, visualizes patch aging to find lingering risks, and uses area charts to track the impact of patching on security rule resolution. Radial and bar charts break down patch counts by product and service, while remediation status tables offer real-time insights by region and resource. Summaries of top missing patches help prioritize critical vulnerabilities. Altogether, these tools support effective, prompt patch deployment and ensure a secure, compliant cloud posture.
Identity Entitlement Management
The Identity Entitlement Report View offers a detailed evaluation of AWS IAM entities, focusing on permission usage, identity hygiene, and high-risk activities to support least-privilege enforcement and risk reduction. It includes comprehensive listings of all IAM groups, policies, roles, and users, highlighting inactive accounts, excessive permissions, and unused entitlements for targeted cleanup. Visualizations categorize excessive permissions by action type, while logs of critical IAM activities provide audit-ready context for sensitive operations. A summary view highlights identity distribution and risk levels, and recommended remediation steps guide security teams toward effective action. Altogether, this report enables ongoing IAM optimization and improved access control across the cloud environment.
Posture Management
The Posture Management Report View provides a comprehensive, region-aware analysis of cloud security posture, enabling teams to check compliance, find high-risk areas, and prioritize remediation. It includes benchmark-based assessments (e.g., CIS, NIST) with severity-level breakdowns, time-series trends of affected resources, and global maps showing the geographic distribution of passed, failed, and unchecked controls. Added charts highlight service-specific findings, categorize issues by severity, and pinpoint publicly exposed resources. A radar chart finds the top affected regions, guiding location-based risk mitigation. Together, these insights support continuous compliance, proactive remediation, and strategic posture improvement across cloud environments.
Custom
The Custom Report View feature allows users to create tailored reports beyond the default views, enabling more focused and effective analysis of organizational data. Users can assign meaningful labels to each report, apply filters to isolate specific information within widgets, and customize views for targeted insights, such as highlighting publicly accessible resources. Additionally, backup schedules setup helps capture data over set time periods, with the possibility to distribute these backups via email. This flexibility supports in-depth troubleshooting, continuous monitoring, and efficient reporting across various tools.
Start Customizing Your Report Views
With SanerCloud Report Views, create your own custom reports to match specific compliance goals and operational needs. Filter, Visualize, Automate, and Distribute for actionable insights and compliance outcomes in your cloud infrastructure.
Setup the Filters of What You Want to See
Setting up filters and including multiple analyses gives you a complete and consistent view of your company’s information across all departments and operational data sources.
When you embed a report analysis view onto the page, the analysis automatically displays the most current data every time the scan is run. For example, if you need to see the active resources based on geo-location, then you can run the scan and access the report view to see the most up-to-date information.
Cloud Provider
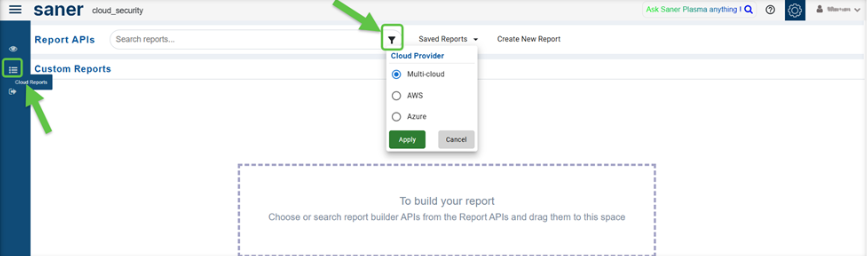
For visualization and analysis, get a complete and consistent view of your company’s information across the different Cloud Providers.
Multi-cloud
Retrieves the combined count of AWS and Azure reports based on your search and displays them in the Custom Reports section.
AWS
Retrieves reports only from AWS based on your search and displays them in the Custom Reports section.
Azure
Retrieves reports only from Azure based on your search and displays them in the Custom Reports section.
Map Views
Users can search Report APIs with filters such as region-wise mapping, top 5 regional findings, and more. When hovering over specific points (dots) on the map, a tooltip displays the corresponding region and country. Zoom levels can be adjusted using the available buttons. Additionally, users can resize and reposition the report view on the page or download it as a CSV file for further analysis.
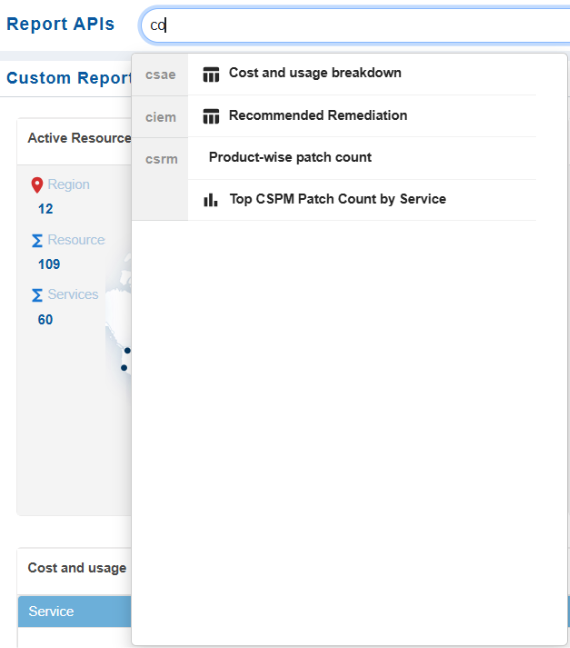
Service Charts
Searching for “Services” under Report APIs displays categorized report options. Each entry corresponds to a specific API-based report focused on cloud services. Visual icons, such as line charts and bar charts, provide a quick sign of the type of data visualization used in each report.
Critical Activity Table and Other Views
Searching the Report APIs for “Critical Activities” displays categorized report options. The report entry links to an API-based report showing the visual icon suggesting a tabular or summary format related to sensitive operations.
Configure Backup Schedule
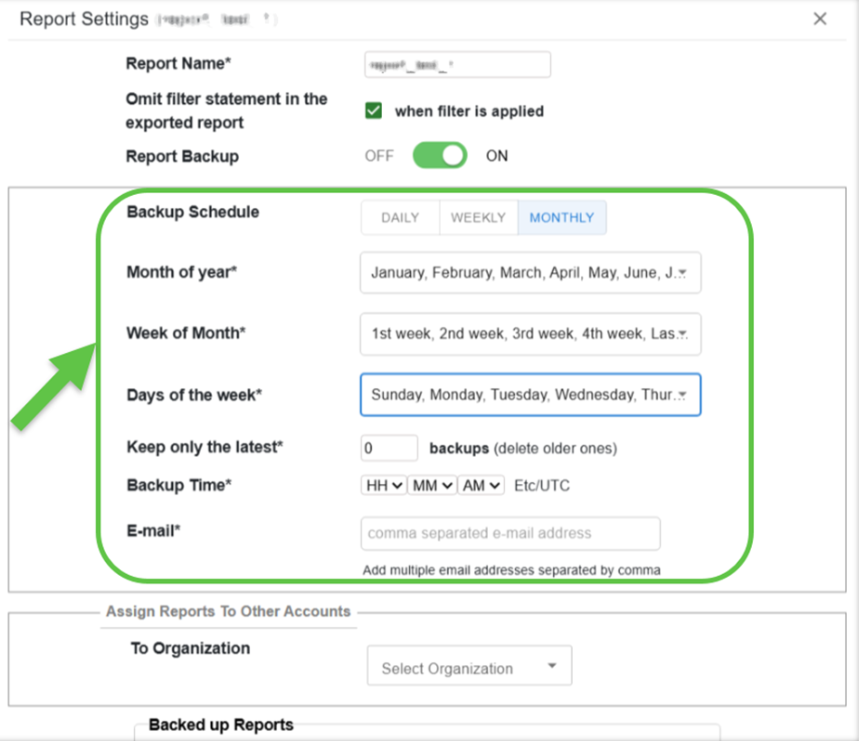
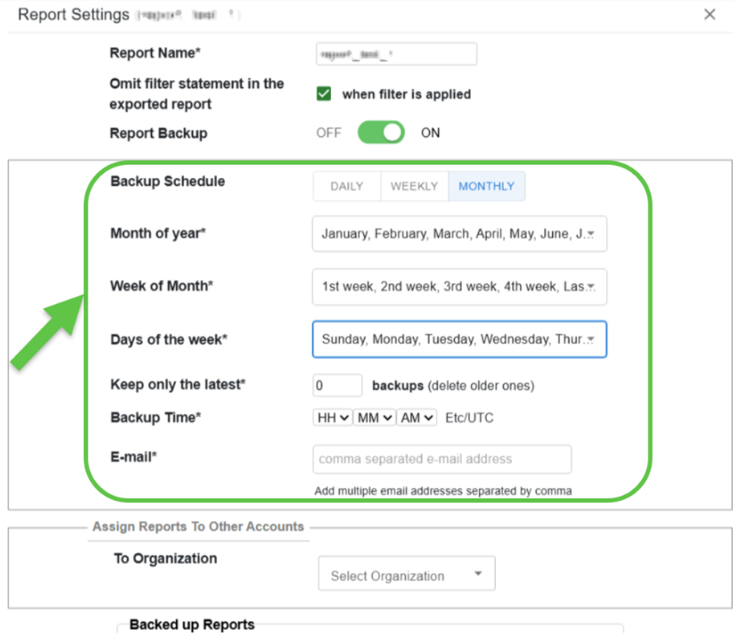
From the Report Settings interface users can configure automated report backups with flexible scheduling options. Users can enable or disable backups, choose to omit filter statements in exports, and customize the backup frequency, daily, weekly, or monthly.
In the monthly schedule view, users can select specific months, weeks, and days for the backup to run. Added settings include keeping a set number of recent backups, specifying the exact backup time with time zone, and entering email addresses to receive the backup reports. This setup ensures reports are systematically archived and accessible as needed.
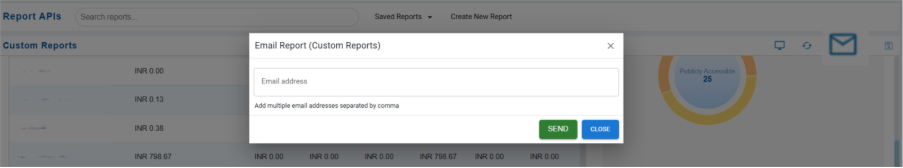
Share the Report Backup Views to a Broader Group
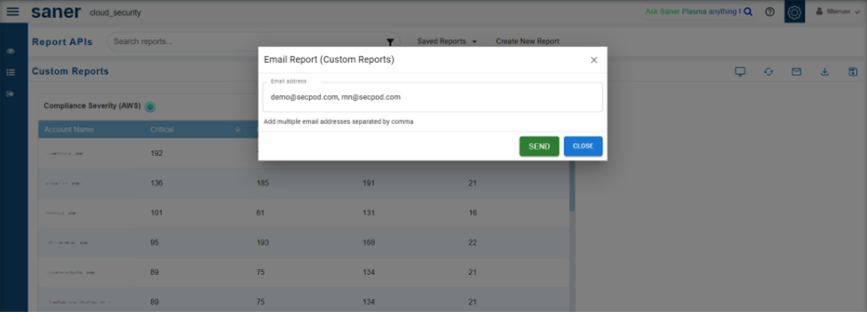
Sharing backup report views with a wider audience enhances visibility into backup health, compliance, and coverage across teams such as security, DevOps, and compliance. These reports provide insights into backup frequency, adherence to policies, and instances of failure, which can drive accountability and improve operations.
For sharing these reports, it is essential to ensure proper role-based access and configure relevant filters, such as time periods or regions. Use platform-specific settings to grant proper view or edit access. Additionally, consider enabling scheduled report delivery for ongoing collaboration.
Best practices for secure and effective report sharing include clear labeling, careful handling of sensitive data, and auditing shared activities.
Go Further
Saner Cloud is a comprehensive solution designed to help organizations effectively manage their cloud operations. Key features of the product include asset exposure, posture management, posture anomaly detection, identity and entitlement management, and remediation management.
Documentation is organized to help you quickly and efficiently find the information you need, whether you’re troubleshooting, learning how to use specific tools, or seeking in-depth knowledge about the product suite.
Discover how Saner Cloud Reports helps customize your report views to gain actionable insights into your cloud infrastructure. Schedule your trial today for a more comprehensive experience!