
Managing expenses related to compute, storage, AI, and networking services can become complex, especially when costs accumulate across different teams and projects without clear visibility. To effectively navigate this dynamic environment, it’s important to have a detailed understanding of where costs are being incurred, how services are being consumed, and what emerging trends may be influencing these expenses.
Implementing a Cost and Usage Graph is more than just charts; it’s about fostering a data-driven culture.
This article provides a structured overview of managing cloud spending using a user-centric and data-driven approach.
Understanding Cloud Costs
Cloud security begins with achieving complete visibility and effective resource management. This is essential not only for reducing costs but also for minimizing the cloud attack surface. The challenge many organizations face is the lack of a comprehensive understanding of all the resources they have in the cloud, what those resources are being used for, and what they are paying for them.
Begin by gaining a clear understanding of your cloud expenses and usage and assess for underutilized or idle resources.
Follow the link to read more about cloud cost optimization strategies: https://aws.amazon.com/premiumsupport/support-cloud-cost-optimization/
What does Cost Analysis Entail?
A structured cost analysis approach involves organizing your cloud spend data by service, project, region, and account. With a structured model:
- You can segment costs by business unit or environment (e.g., dev/test/prod)
- Track historical usage patterns and forecast future spend
- Detect anomalies or spikes indicating potential misconfigurations or over-provisioning
This enables organizations to transition from reactive to proactive cloud financial management.
Cloud Cost and Usage Analysis: Implementation Architecture
Implementing an effective Cost and Usage Analysis system involves integrating cloud billing data, transforming and storing it, and then visualizing it with interactive dashboards. Below is a detailed look at each component of the architecture and how it works.
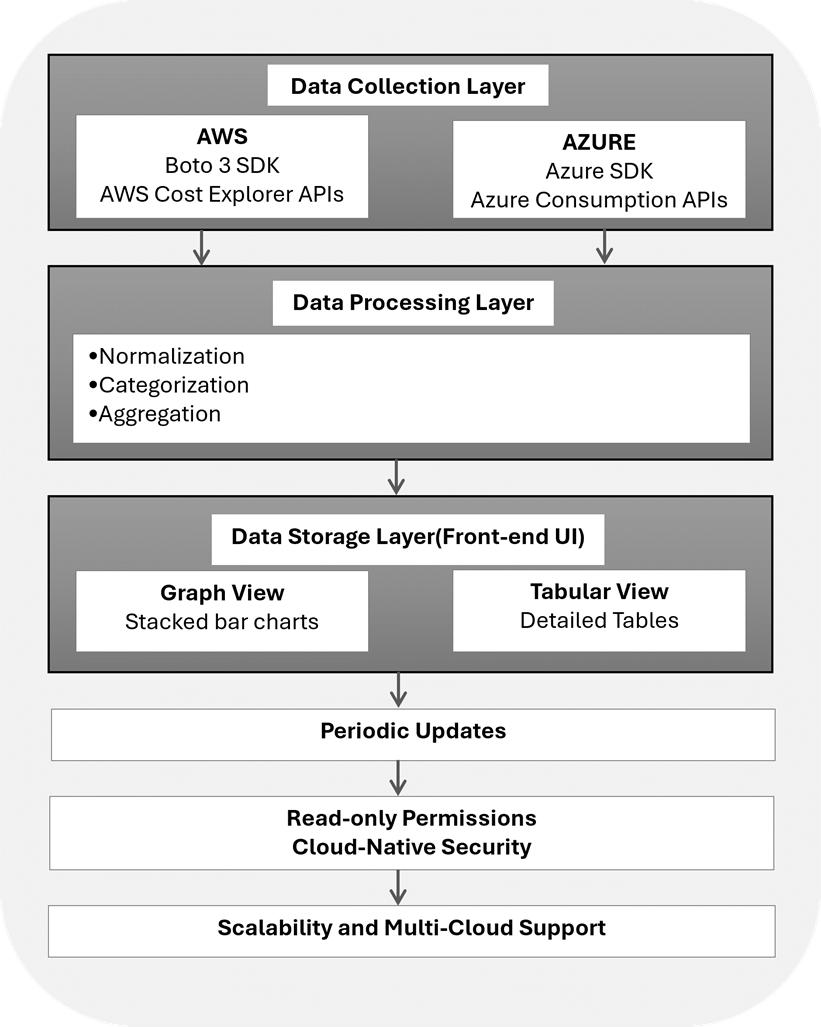
Data Collection Layer
The Data Collection Layer collects cost and usage data from both AWS and Azure cloud platforms.
On AWS, the system utilizes the Boto3 SDK to interact with AWS Cost Explorer APIs, retrieving both actual usage data and forecasted cost estimates.
On Azure, it uses the Azure SDK to connect with Azure Consumption Management APIs for retrieving similar data, including actual usage and forecasted costs.
Data Processing Layer
In the Data Processing Layer, once the raw cost data is collected from AWS and Azure, it undergoes multiple transformations.
Data is normalized to align formats across the two cloud platforms. Next, it is categorized based on attributes such as cloud services (e.g., EC2, S3, Azure VM, Azure Storage), account or subscription, and time periods (daily or monthly).
Following categorization, the data is aggregated to enable analysis by service, time, or organizational unit.
Data Storage Layer
The Data Storage Layer stores the processed data in a backend database. The database schema is optimized for trend analysis using time-series views and service-level insights, such as cost breakdowns by cloud service.
In the Data Presentation Layer (Frontend UI), cost data is visualized through two primary views:
- The Graph View uses stacked bar charts to display monthly cost trends by service, helping quickly identify high-spend areas.
- The Tabular View presents a detailed table showing actual costs per cloud service and per time period, offering clear financial overviews.
Automation and Data Freshness
Automation and Data Freshness are ensured through periodic updates.
Data pull and refresh operations are scheduled routinely to maintain the availability of the latest usage and cost metrics.
Security and Access Control
In terms of Security and Access Control, read-only permissions are enforced to maintain data integrity.
Cloud-native security mechanisms such as IAM Roles (for AWS) and RBAC (Role-Based Access Control) for Azure are employed.
Scalability and Multi-Cloud Support
The architecture is designed with scalability and multi-cloud support as key considerations. It is cloud-agnostic, meaning it supports both AWS and Azure, and has the capability to extend to additional cloud providers in the future. Additionally, it is scalable, allowing for growth in cloud services, accounts, or regions. This design ensures that it is future-ready, enabling comprehensive visibility and optimization across multiple cloud environments.
Data Driven Analysis on Cost and Usage
In a real-time Dashboard View:
The stacked bar chart view that shows monthly costs broken down by individual services. You can examine several key aspects of the service. This includes:
- Identifying the month with the highest expenditures
- Months with lower spending
- Estimated versus Actual spending for the current month and across different months
- Tax amount as a proportion of the total cost across various services
You may also observe trends such as:
- Minimal usage in certain months
- Noticeable spikes or diversified use of services in specific months
- Sharp increases driven by certain services that may have distinct cost components
What to Infer from the Estimated Grand Total for Current Month?
This indicates that apart from the service-specific charges, there may be:
- Additional AWS Marketplace costs
- Unblended charges or credits
- Reserved instance amortization
- Or other line items
Breakdown/Detailed Tabular View lists the actual costs per service, per month, in dollars, providing a clear and concise financial overview. You also have an option to filter and view services of focus to you, search by services, and determine the number of records you want to see in the view.
Currency Handling with Cloud Service Providers
In multi-cloud and multi-region environments, accurately handling currency is essential for ensuring reliable cost visibility. By handling currency effectively, users can gain visibility across multiple regions and achieve accurate cost consolidation. This approach also assists finance teams in budgeting with local currencies, eliminating confusion in situations where some accounts bill in local(regional) currency and others in USD. As a result, it enhances clarity in trend analysis, forecasting, and related activities.
Let’s take a closer look at how the system provides support for currency normalization and conversion to maintain consistency in financial reporting across AWS and Azure.
Native Billing Currency Support
AWS allows you to set your preferred billing currency (such as INR, USD, or EUR) from the billing console. Once selected, the Cost Explorer API returns all cost and usage data in that currency. For example, if you choose INR, any data retrieved via “Boto3” is automatically converted from USD to INR using AWS’s internal daily exchange rates.
On the other hand, in Azure, the billing currency is determined when you create a subscription. The Consumption Management API provides all cost and usage data in the assigned currency (for example, INR for subscriptions billed in India). Azure handles currency conversions internally, using regional exchange rates based on the billing country.
Multi-Currency Normalization (Optional)
When aggregating cost and usage data across multiple cloud accounts or subscriptions, especially from providers that report in different currencies, a currency normalization layer becomes critical for accurate and consistent reporting.
This layer establishes a base currency (commonly USD or INR) and converts all cost data to that currency to ensure uniformity in financial analysis. For any cost data reported in a different currency, the system automatically applies the relevant currency conversion rates.
These rates are either:
- Retrieved directly from cloud provider metadata (if available), or
- Fetched from reliable external sources like OpenExchangeRates or Fixer.io, using up-to-date daily exchange rates.
This approach ensures that all cost figures are standardized and comparable, enabling clear visibility across regions, cloud providers, and billing configurations.
Summary
AWS and Azure APIs provide costs in either local(regional) currency or USD based on the billing settings. If a user has mixed currencies, all values get converted to a single base currency (either INR or USD) using the applicable exchange rates for conversion.
Few Common Usage Trends, Observations, and Recommendations
- Spending Peaks in Specific Months(for example, February): High spend (EC2/VM) during some months due to seasonal load. Consider spot instances, saving plans, or scheduled shutdowns etc.
- Underutilized Instances: 15% of EC2 costs come from idle instances, the target for right-sizing or automation. Analyse and optimize EC2 usage patterns.
- Data Transfer Costs: Spending a lot on data transfer via NAT Gateway and CloudFront. Consider using AWS Global Accelerator (for better, possibly cheaper routing) or S3 Transfer Acceleration (to reduce S3 upload/download costs) to optimize these expenses.
- Monitoring Creep: As CloudWatch logs and metrics grow, set lifecycle policies to control cost.
Track Cloud Spend and Stay in Control
Your cloud bill is not just a number, it’s a story. Whether you’re on AWS or Azure, review regularly for top services, anomalies, and unused assets.
To better understand how you’re spending across services, Saner Cloud Asset Exposure(CSAE) provides a chart and tabular view(detailed line-by-line breakdown of services) turning granular cost and usage data into meaningful, actionable insights.
Go Further
Saner Cloud is a comprehensive solution designed to help organizations effectively manage their cloud operations. Key features of the product include asset exposure, posture management, posture anomaly detection, identity and entitlement management, and remediation management.
Documentation is organized to help you quickly and efficiently find the information you need, whether you’re troubleshooting, learning how to use specific tools, or seeking in-depth knowledge about the product suite.
Discover how Saner CSAE is designed to manage your cloud spend. Schedule your trial today for a more comprehensive experience!